“Hook,” they say. “Pull the reader headfirst into your story. Keep them there. Give them a reason to stay scrunched in that uncomfortable position with desperate pins and needles, just to keep turning the page.”
“Already one step ahead of you,” we want to reply smugly. We all love to think that our stories have that particular wow factor.
But sometimes we can be uncertain. We might need proof. Proof that we’re on the right track, that our story flows, that we’re covering all bases – proof for whatever other neuroticisms we writers occasionally suffer from.
Seeing as we’re writers and all, I can predict that quite a few of you favoured ‘English/Arts’ subjects over ‘Maths’ subjects at school. Essays, comprehension questions, creative writing came naturally. Algebra, calculus, geometry… nyyyeaahhh. Wasn’t… too… bad… Not my forte, for sure, but I did appreciate some things.
For example, I liked getting a question right. Simple as that. But because I knew there was a definite answer that would either get me a mark or none, hitting the nail on the head was reliably satisfying. Maths concepts are much more ‘black and white’ than ‘Arts’ ones. When marketers grapple at our sleeves, chances are they’ll have numbers slathered everywhere. “25% more nutrients”, “Supplies 50% of your daily calcium intake” and don’t forget that infamous “50% off storewide”. It’s a world of numbers.
Maybe that’s what we need sometimes – just a few numbers. Not too much, lest we do our creative minds in. But just a little; some simple figures or graphs that we can market to ourselves as ‘proof’.
I came up with the idea of using graphs a few months ago. I think I’d read somewhere that a writer would rate each of their scenes on a scale, depending on how ‘exciting’ it was. I decided to do the same thing but also threw in an easy line graph using Excel. Then, as I was writing this post, I came up with another use and realised that there are many different possibilities out there. Today I’m going to share ideas about two of them: action ratings and character/story arc/location proportions.
I’ll also provide downloads of sample Excel spreadsheets for you to get started. Ready? Set go!
Action ratings
Many things can keep the reader stuck in your book. Characters are a big one, plot another. The flow of a story is more subtle, but equally important. Have you ever read a book with an interesting plot or premise, but didn’t feel satisfied with the story itself? Maybe it was too slow in some parts, or the climax happened too suddenly without suspense. Perhaps it was lacking character development, or the events were just strung up too tightly throughout the book without a break, to the point you felt tired for the characters.
Stories go through different stages of action. Ordinary life scenes are low action but key to subtle character development, and can be spiced up by some info-dropping. Climax scenes should really feel like the climax. Then there’s the transitions between.
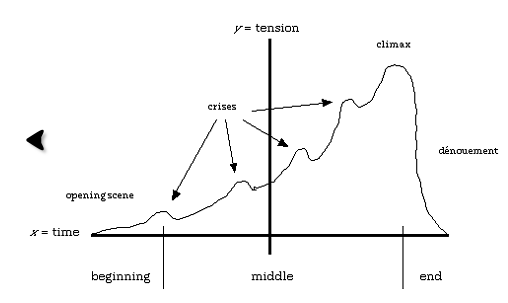
The progression of a typical story.
From: http://digitalworlds.wordpress.com/2008/04/07/story-arcs-and-the-three-act-structure/

The Hero’s Journey ‘W Graph’
HIGHLY RECOMMENDED original source: http://emilybreder.com/2013/01/13/fiction-writers-cheat-sheet/
Graphing Action
First decide on a legend – your ratings. What is a 1? What constitutes a 7? What’s the difference between a 9 and a 10? Write it down somewhere.
Rate each chapter (or scene if you prefer) with an action rating. Overall, is it a high tension chapter or a build up to greater things? Is it completely unnecessary filler?
This is an example I made just then. (Don’t mind my legend too much. It’s a first draft that works for my story/writing style – yours is welcome to be different).

Using a graph like this you can clearly keep track of how ‘interesting’ each chapter is. If your climax isn’t a 10, there’s a problem. If you have too many <4 chapters, your story could be moving along too slowly. If you admit you have a 1, does that scene need to be there? Can you bump it up to a 3? It might be all it takes to keep your readers reading.
A healthy graph would look similar to the ones I posted previously as examples: a W structure with peaks and recovery periods. It also depends on your genre. A mystery crime novel would spend a lot of time in the high numbers. A chicklit might be lower range. Even though I am writing an action fantasy series, I am a heavily character-focused writer; this is why I have a rating for character development. This is why it is important to have your own legend scale, tailored for your story and your writing style.
Download link to my sample action ratings Excel spreadsheet (97-2003 compatible): Action ratings
Note: You can update each chapter’s ratings as you go. The graph should update live.
Characters/Story Arcs/Locations
If your story has a broad cast of characters, they will typically range in importance. You might have several main characters, lead supporting characters, background characters and passerbys. It’s hard to remember everyone.
You might want to know the proportion of time you spend on your main characters. You may have two main characters – do you spend more time on one? Was that your plan? If you’ve decided you want a refreshing scene with some lesser seen characters, are you sure the ones you pick are lesser seen? Are your ‘rising star’ characters actually not in enough scenes to feel like they are meeting the role?
Likewise, story arcs work the same way. Typically a novel has subplots. They could happen in parallel. Some are important, some are less so. Spending too much time on a small subplot can decrease the significance of your main plot.
Again with location. Do you spend too much time in one place? Are you spending too little time in too many places? Does the main location receive enough exposure to come across as the main location?
To manage this, I thought of using either a pie or doughnut graph. I went with the latter in honour of Homer Simpson.
 It’s pretty obvious who my main character is, right? Yet the top 3 characters are not my main 3 characters. Misleading? Flynn, Arven and Eleanor are actually my main characters – in the long run. This is a rough estimate of the proportions (not the exact number of scenes) that I can currently see happening in Book 1. These proportions will change as the story progresses. That’s okay. What’s important is that I know I’m on the right track; that by the end I haven’t completely neglected poor Tristan, who is a supporting character – and a cowardly one who runs from action, too – because it’s easy for me to write him off as a background character when he’s actually really good buddies with Flynn.
This obviously won’t work if you cram your entire cast into the graph. Think Game of Thrones – not going to work. Even Harry Potter might be stretching it. This graph is ideal only for, say, a maximum average of 10 characters. It depends on your needs. You can create an entry for ‘Others’ and accumulate everyone else’s appearances in there. You could create two separate graphs: one for main characters, another for supporting. The freedom is yours.
I used characters as an example but like I mentioned, this can just as easily be done with subplots/arcs, locations and anything else you think could make use of such a graph. Play around!
Download link to my sample graph Excel spreadsheet (97-2003 compatible): Proportions graph
~~~
There are a range of other ways you can use graphs to aid your writing. I’ll post more ideas if I think of any. Experiment and see what works for you. It might be just what you needed or the worst thing you’ve ever attempted. You never know until you try. I hope someone found this post helpful! If you need any help with the spreadsheets, leave a comment and I’ll be happy to help.
Write on,
Christine
Have you used a similar technique before? Yay or nay? Going to try it out? What are your graph ideas?


